
 대표어
대표어


권호기사보기
| 기사명 | 저자명 | 페이지 | 원문 | 기사목차 |
|---|
결과 내 검색
동의어 포함
영문목차
Title page=0,1,4
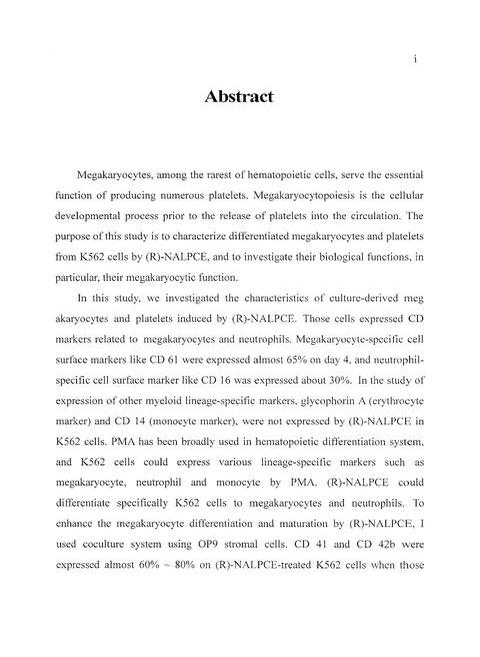
Abstract=i,5,4
Contents=v,9,3
List of Figures=viii,12,3
List of Tables=xi,15,1
Abbreviations=xii,16,2
1. INTRODUCTION=1,18,1
1.1. Background=1,18,4
1.2. Megakaryocytopoiesis (Megakaryocyte cell biology)=4,21,5
1.3. Differentiation system asing OP9 stromal cells=8,25,2
1.4. Integrin αIIbβ₃(Glyeoprotein IIb/IIIa) signaling(이미지참조)=9,26,3
1.5. Model of platelet production=11,28,5
1.6. Transcriptional regulation of megakaryocyte differentiation=15,32,4
2. MATERIALS&METHODS=19,36,1
2.1. Reagents=19,36,2
2.2. Cell culture and differentiation of megakaryocytes=20,37,2
2.3. Cytotoxicity and growth assay=21,38,1
2.4. Flow cytometric analysis and cell sorting=21,38,2
2.5. Fibrinogen binding assay=22,39,1
2.6. Transmission electron microscopy=23,40,1
2.7. Fluorescence image=23,40,2
2.8. Immunoblotting=24,41,1
2.9. Oligonucleotide array=24,41,1
2.10. Total RNA preparation and RTPCR=24,41,2
2.11. Northern hybridization=25,42,2
2.12. siRNA transfection=26,43,1
3. RESULTS=27,44,1
3.1. Functional analysis of differentiated K562 cells by (R)NALPCE=27,44,1
3.1.1. Cytotoxicity and growth of (R)NALPCEtreated K562 cells=27,44,2
3.1.2. Expression of hematopoietic cell surface markers in (R)NALPCEtreated K562 cells=28,45,5
3.1.3. Comparison data of hematopoietic specific cell surface markers between (R)NALPCEand PMAtreated K562 cells=32,49,2
3.1.4. Morphological changes of (R)NALPCEtreated K562 cells cocultured with OP9 stromal cells=33,50,6
3.1.5. Expression of hematopoietic cell surface markers in (R)NALPCEtreated K562 cells cocultured with OP9 stromal cells=38,55,4
3.1.6. Fibrinogen binding of (R)NALPCEtreated K562 cells cocultured with OP9 stromal cells=41,58,7
3.1.7. Fluorescence image of culturederived megakaryoeytes by (R)NALPCE=47,64,4
3.1.8. Transmission electron micrograph of culturederived megakaryocytes and plateletlike cells by (R)NALPCE=50,67,4
3.2. Study of gene expression by (R)NALPCE during megakaryocytic differentiation=54,71,1
3.2.1. Sustained MAPK expression during megakaryoeytic differentiation induced with (R)NALPCE=54,71,4
3.2.2. Data analysis of oligonucleotide array=57,74,5
3.2.3. Induction of IL8 gene expression by (R)NALPCE during megakaryoeytie differentiation=62,79,1
3.2.4. IL8 expression inhibited by siIL8=62,79,5
3.2.5. Modulation of cell surface markers in (R)NALPCEtreated K562 cells by siIL8=66,83,4
4. DISCUSSION=70,87,7
REFERENCES=77,94,17
[Abstract in korean]=94,111,4
Acknowledgement=98,115,3
Appendix=101,118,2
Fig.1. Structural formula for (R)NALPCE (M.W. 550.71)=2,19,1
Fig.2. Growth factors involved in megakaryocyte growth and maturation=6,23,1
Fig.3. Glycoprotein IIB/IIIa (IntegrinαIIbβ₃) structure(이미지참조)=12,29,1
Fig.4. Model illustrating the sequence of events throughout thrombin induced signaling process=13,30,1
Fig.5. The production mechanism of platelets from mature megakaryocytes=16,33,1
Fig.6. The cytotoxicity of (R)NALPCE for K562 cells=29,46,1
Fig.7. The cytotoxicity of (R)NALPCE for MEG01 cells=30,47,1
Fig.8. The cell growth curve of (R)NALPCE for K562 cells=31,48,1
Fig.9. Expression of hematopoietie cell surface markers in (R) NALPCEtreated K562 cells=34,51,1
Fig.10. Timedependent CD 61 expression in (R)NALPCEtreated K562 cells=35,52,1
Fig.11. Concentrationdependent CD 61 expression in (R)NALPCEtreated K562 cells=36,53,1
Fig.12. Comparison data of hematopoietic specific cell surface markers between (R)NALPCEand PMAtreated K562 cells=37,54,1
Fig.13. Morphological changes of K562 cells cocultured with OP9 cells=39,56,1
Fig.14. Morphological differences between (R)NALPCEand PMAtreated K562 cells cocultured with OP9 stromal cells=40,57,1
Fig.15. Expression of hematopoietice cell surface markers in (R)NALPCEtreated K562 cells cocultured with or without OP9 stromal cells=42,59,1
Fig.16. Concentrationdependent CD 41 expression in (R)NALPCEtreated K562 cells with or without OP9 stromal cells=43,60,1
Fig.17. Timedependent CD 41 expression in (R)NALPCEtreated K562 cells with or without OP9 stromal cells=44,61,1
Fig.18. Timedependent CD 42b (GP Ibα) expression in (R)NALPCEtreated K562 cells with OP9 stromal cells=45,62,1
Fig.19. Fibrinogen binding to αIIbβ₃expressing (R)NALPCEtreated K562 cells cocultured with OP9 stromal cells(이미지참조)=48,65,1
Fig.20. Fibrinogen binding of CD 41positive K562 cells differentiated by (R)NALPCE in coculture system=49,66,1
Fig.21. Fluorescence image of (R)NALPCEtreated K562 cells cocultured with OP9 stromal cells activated by a combination of agonist mixture=51,68,1
Fig.22. Transmission electron microscopy of megakaryocytes derived from (R)NALPCEtreated K562 cells=52,69,1
Fig.23. Transmission electron microscopy of platelets derived from (R)NALPCEtreated K562 cells=53,70,1
Fig.24. ERK1/2 activation in (R)NALPCEtreated K562 cells=55,72,1
Fig.25. ERK1/2 activation in (R)NALPCEtreated K562 cells with various inhibitors=56,73,1
Fig.26. Fold induction genes regulated by (R)NALPCE and LY294002+(R)NALPCE=61,78,1
Fig.27. The expression of IL8 by (R)NALPCE during megakaryocyte differentiation=63,80,1
Fig.28. Northern blot analysis of IL8 RNA expression in (R) NALPCEtreated K562 cells=64,81,1
Fig.29. The expression of IL8 by (R)NALPCE and LY294002 treated before (R)NALPCE stimulation=65,82,1
Fig.30. IL8 expression inhibited by siIL8=68,85,1
Fig.31. Comparison data of megakaryocyte, neutrophil specific cell surface marker with or without siIL8 in 73 μM (R)NALPCEtreated K562 cells with or without OP9 stromal cells=69,86,1
*표시는 필수 입력사항입니다.
| 전화번호 |
|---|
| 기사명 | 저자명 | 페이지 | 원문 | 기사목차 |
|---|
| 번호 | 발행일자 | 권호명 | 제본정보 | 자료실 | 원문 | 신청 페이지 |
|---|
도서위치안내: / 서가번호:

우편복사 목록담기를 완료하였습니다.
*표시는 필수 입력사항입니다.
저장 되었습니다.
