
 대표어
대표어

권호기사보기
| 기사명 | 저자명 | 페이지 | 원문 | 기사목차 |
|---|
결과 내 검색
동의어 포함
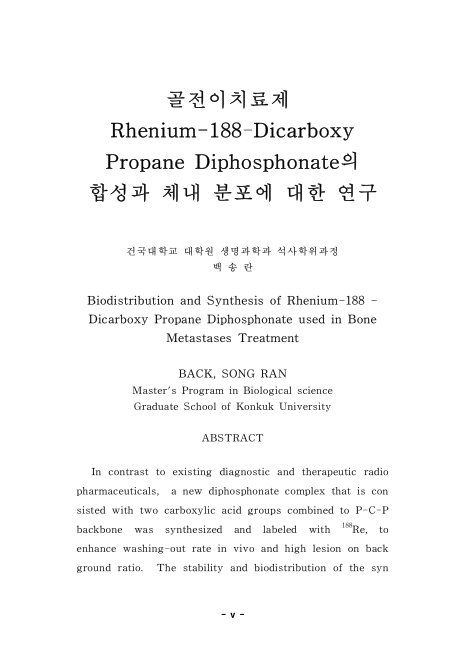
ABSTRACT
목차
Ⅰ. 서론 7
Ⅱ. 실험 재료 및 방법 13
1. 실험재료 13
⑴ 실험동물 13
⑵ 연구재료 및 기기 13
2. 실험방법 13
⑴ 일반적인 188Re-DPD의 표지 13
① Sncl2·2H2O 농도의 영향 14
② pH의 영향 14
③ 가열시간의 영향 15
④ DPD 농도의 영향 15
⑤ 담체 농도의 영향 15
⑵ 188Re-DPD의 안정도 측정 16
⑶ 마우스에서 188Re-DPD의 생체 내 분포 16
⑷ 랫트의 영상 17
⑸ 통계학적 분석 17
Ⅲ. 결과 18
1. 188Re-DPD의 합성에 영향을 미치는 인자 18
① Sncl2·2H2O 농도의 영향 18
② pH의 영향 18
③ 가열시간의 영향 18
④ DPD 농도의 영향 19
⑤ 담체 농도의 영향 19
⑵ 188Re-DPD의 안정도 측정 결과 19
⑶ 마우스에서 188Re-DPD의 생체 내 분포 19
⑷ 랫트의 영상 20
Ⅳ. 고찰 30
Ⅴ. 요약 34
Ⅵ. 참고문헌 35
Figure 1. Chemical structure of diphosphonate complexes 7
Figure 2. Effect of the concentration of stannous chloride on the radichemical yield of 188Re-DPD using carrier free 188Re. 188Re-DPD showed 96.9% of radiochemical yield with 1.0 mg/ ml of reducting agent at pH 1. (pH 1, 100℃/30 min, glutamic acid 1.0 mg 21
Figure 3. Effect of pH on the radiochemical yield of 188Re-DPD using carrier free 188Re. 188Re-DPD showed ]90 % radiochemical yield at acidic PH, radiochemical yield dec reased at pH higher than 3. (DPD 0.05 mmol/ml, SnCl2� 2H2O 1.0 mg/ml, glutamic acid 1.0 mg/ml) 22
Figure 4. Effect of reaction time radiochemical yield of 188 Re-DPD using carrier free 188Re at boiling water 188Re-DP D showe d th e h ig h est rad ioch emical y ield at 6 0min at p H 1 . (DPD 0.05 mmol/ml, SnCl2�2H2O 1.0 mg/ml, glutamic acid 1.0 mg/ml, pH 1) 23
Figure 5. Effect of the concentration of DPD using carrier free 188Re. 188Re -DPD showed 96.4% of radiochemical yie ld with 0.05 mmol/ml of ligand. (pH 1, 100℃/30 min, SnCl2 ·2H2O 1.0 mg/ml, glutamic acid 1.0mg/ml) 24
Figure 6. Effect of concentration on carrer of 188Re-DPD. Ammonium perrhenate was used as carrier. After 188Re-perr henate 370 MBq/ml was added to this individual concentration, It was boiled in 100℃ for 30 min and we measured radiochemical purity. 188Re 25
Figure 7. Anterior views whole body images of rats. 26
*표시는 필수 입력사항입니다.
| 전화번호 |
|---|
| 기사명 | 저자명 | 페이지 | 원문 | 기사목차 |
|---|
| 번호 | 발행일자 | 권호명 | 제본정보 | 자료실 | 원문 | 신청 페이지 |
|---|
도서위치안내: / 서가번호:

우편복사 목록담기를 완료하였습니다.
*표시는 필수 입력사항입니다.
저장 되었습니다.
