
 대표어
대표어
 학술연구정보서비스(KERIS)

권호기사보기
| 기사명 | 저자명 | 페이지 | 원문 | 기사목차 |
|---|
결과 내 검색
동의어 포함
표제지
국문초록
목차
제1장 서론 11
1.1. 연구 배경 11
1.2. 연구 목적 13
제2장 연구 동향 14
2.1. 월류에 의한 붕괴 특징 분석 14
2.2. 기존 첨두유량 경험식 21
제3장 배경 이론 24
3.1. 차원 해석 24
3.2. 첨두유량 (Qₚ)의 측정 26
제4장 수리 실험 27
4.1. 실험 설정 27
4.1.1. 댐의 기하학적 특성 27
4.1.2. 댐을 구성하는 모래의 특성 29
4.2. 실험 방법 31
제5장 결과 및 분석 35
5.1. 실험 결과 및 분석 35
5.1.1. Sand 1 모래를 사용한 월류 붕괴 실험 결과 35
5.1.2. Sand 2 모래를 사용한 월류 붕괴 실험 결과 44
5.2. 무차원화 분석 결과 55
5.2.1. 무차원 첨두유량과 무차원 모래 입경 분석 결과 55
5.2.2. 무차원 첨두유량과 하류 사면경사 분석 결과 56
5.2.3. 무차원 첨두유량과 무차원 저수 부피 분석 결과 57
5.3. 첨두유량 경험식 58
제6장 결론 63
참고문헌 65
Abstract 71
그림 2.1. Outflow characteristics for the breach stages 18
그림 3.1. Schematic diagram of reservoir 24
그림 4.1. Schematic diagram of physical experiment 27
그림 4.2. Grain size distribution 29
그림 4.3. Geometry of dam 32
그림 5.1. Over-topping discharge of Sand 1 for VR=0.0225 ㎥[이미지참조] 36
그림 5.2. Over-topping discharge of Sand 1 for VR=0.027 ㎥[이미지참조] 37
그림 5.3. Over-topping discharge of Sand 1 for VR=0.031 ㎥[이미지참조] 37
그림 5.4. Over-topping discharge of Sand 1 for VR=0.036 ㎥[이미지참조] 38
그림 5.5. Over-topping discharge of Sand 1 for VR=0.0405 ㎥[이미지참조] 38
그림 5.6. Over-topping discharge of Sand 1 for VR=0.045 ㎥[이미지참조] 39
그림 5.7. Over-topping discharge of Sand 1 for VR=0.063 ㎥[이미지참조] 39
그림 5.8. Over-topping discharge of Sand 1 for VR=0.081 ㎥[이미지참조] 40
그림 5.9. Over-topping collapse process of case D65V45S5 with respect to time 43
그림 5.10. Over-topping discharge of Sand 2 for VR=0.0225 ㎥[이미지참조] 44
그림 5.11. Over-topping discharge of Sand 2 for VR=0.027 ㎥[이미지참조] 45
그림 5.12. Over-topping discharge of Sand 2 for VR=0.0315 ㎥[이미지참조] 45
그림 5.13. Over-topping discharge of Sand 2 for VR=0.036 ㎥[이미지참조] 46
그림 5.14. Over-topping discharge of Sand 2 for VR=0.0405 ㎥[이미지참조] 46
그림 5.15. Over-topping discharge of Sand 2 for VR=0.045 ㎥[이미지참조] 47
그림 5.16. Over-topping discharge of Sand 2 for VR=0.063 ㎥[이미지참조] 47
그림 5.17. Over-topping discharge of Sand 2 for VR=0.081 ㎥[이미지참조] 48
그림 5.18. Over-topping collapse process of case D20V45S5 with respect to time 51
그림 5.19. Comparison of peak time and discharge 52
그림 5.20. Comparison of collapse time 53
그림 5.21. Peak discharge with respect to reservoir volume 54
그림 5.22. Dimensionless peak discharge (Qp /Lcv) with respect to dimensionless particle size (D₅₀ /Lc)[이미지참조] 55
그림 5.23. Dimensionless peak discharge (Qp /Lcν) with respect to downstream slope (SD)[이미지참조] 56
그림 5.24. Dimensionless peak discharge (Qp /Lcν) with respect to dimensionless reservoir volume (VR/Lc3).[이미지참조] 57
그림 5.25. Comparison of observed and calculated dimensionless peak discharge 61
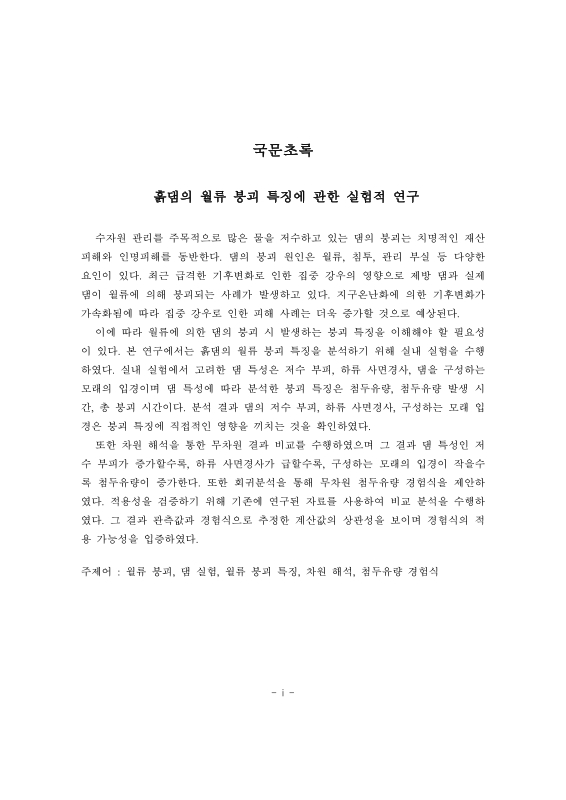
수자원 관리를 주목적으로 많은 물을 저수하고 있는 댐의 붕괴는 치명적인 재산피해와 인명피해를 동반한다. 댐의 붕괴 원인은 월류, 침투, 관리 부실 등 다양한 요인이 있다. 최근 급격한 기후변화로 인한 집중 강우의 영향으로 제방 댐과 실제 댐이 월류에 의해 붕괴되는 사례가 발생하고 있다. 지구온난화에 의한 기후변화가 가속화됨에 따라 집중 강우로 인한 피해 사례는 더욱 증가할 것으로 예상된다.
이에 따라 월류에 의한 댐의 붕괴 시 발생하는 붕괴 특징을 이해해야 할 필요성이 있다. 본 연구에서는 흙댐의 월류 붕괴 특징을 분석하기 위해 실내 실험을 수행하였다. 실내 실험에서 고려한 댐 특성은 저수 부피, 하류 사면경사, 댐을 구성하는 모래의 입경이며 댐 특성에 따라 분석한 붕괴 특징은 첨두유량, 첨두유량 발생 시간, 총 붕괴 시간이다. 분석 결과 댐의 저수 부피, 하류 사면경사, 구성하는 모래 입경은 붕괴 특징에 직접적인 영향을 끼치는 것을 확인하였다.
또한 차원 해석을 통한 무차원 결과 비교를 수행하였으며 그 결과 댐 특성인 저수 부피가 증가할수록, 하류 사면경사가 급할수록, 구성하는 모래의 입경이 작을수록 첨두유량이 증가한다. 또한 회귀분석을 통해 무차원 첨두유량 경험식을 제안하였다. 적용성을 검증하기 위해 기존에 연구된 자료를 사용하여 비교 분석을 수행하였다. 그 결과 관측값과 경험식으로 추정한 계산값의 상관성을 보이며 경험식의 적용 가능성을 입증하였다.*표시는 필수 입력사항입니다.
| 전화번호 |
|---|
| 기사명 | 저자명 | 페이지 | 원문 | 기사목차 |
|---|
| 번호 | 발행일자 | 권호명 | 제본정보 | 자료실 | 원문 | 신청 페이지 |
|---|
도서위치안내: / 서가번호:

우편복사 목록담기를 완료하였습니다.
*표시는 필수 입력사항입니다.
저장 되었습니다.
