
 대표어
대표어

권호기사보기
| 기사명 | 저자명 | 페이지 | 원문 | 기사목차 |
|---|
결과 내 검색
동의어 포함
Title Page
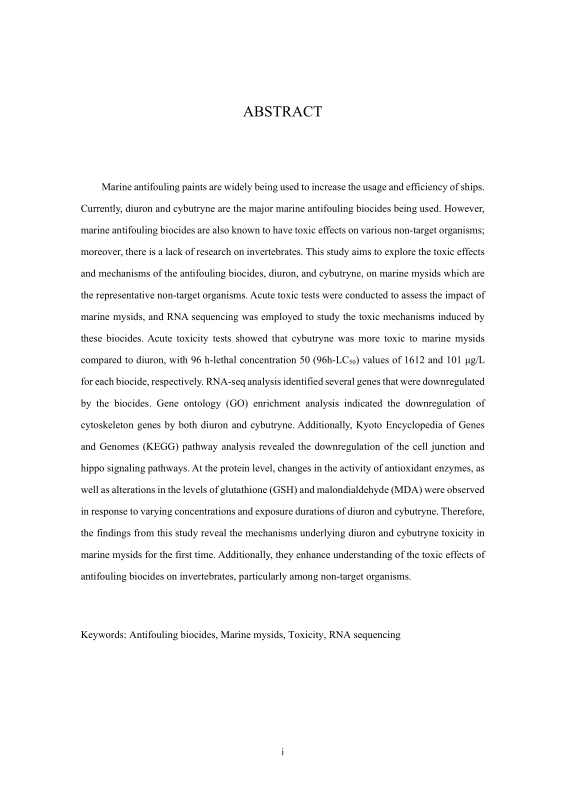
ABSTRACT
Contents
1. Introduction 10
2. Materials and Methods 15
2.1. Preparation of chemicals 15
2.2. Marine mysids culture 15
2.3. Acute toxicity test 15
2.4. RNA extraction and sequencing 16
2.5. De novo assembly and functional annotation 16
2.6. Expression profiling and differential gene expression analysis 17
2.7. Experimental validation by real-time quantitative reverse transcription PCR (qRT-PCR) 18
2.8. Protein extraction and measurement of oxidative parameters 18
2.9. Acridine orange (AO) and fast green (FG) staining 22
2.10. Statistical analysis 22
3. Results 26
3.1. Toxic effects of biocides in N. awatschensis 26
3.2. Transcriptome profiling of biocides in N. awatschensis 30
3.2.1. Differential gene expression of N. awatschensis exposed to biocides 30
3.2.2. Gene ontology (GO) enrichment analysis of N. awatschensis exposed to biocides 40
3.2.3. Kyoto Encyclopedia of Genes and Genomes (KEGG) pathway analysis of N. awatschensis exposed to biocides 45
3.2.4. Stress-related DEGs of N. awatschensis exposed to biocides 49
3.2.5. Validation of transcriptome profiles by qRT-PCR 53
3.3. Oxidative stress parameter measurement of N. awatschensis exposed to biocides 55
3.4. DNA damage measurement of N. awatschensis exposed to biocides 67
4. Discussion 70
5. Conclusion 75
References 76
국문초록 81
Fig. 1.1. Graphical abstract 13
Fig. 2.1. The chemical structures of diuron and cybutryne 23
Fig. 3.1. Survival rates of N. awatschensis exposed to diuron and cybutryne 27
Fig. 3.2. Concentration-response curves of N. awatschensis exposed to diuron and cybutryne A) is concentration-response curve of N. awatschensis at 96 h after exposure to diuron. B) is... 28
Fig. 3.3. Venn diagram of N. awatschensis exposed to diuron and cybutryne 31
Fig. 3.4. Venn diagram of N. awatschensis exposed to 100 μg/L and 1000 μg/L of diuron 33
Fig. 3.5. Networks of overlapping genes in 100 μg/L and 1000 μg/L of diuron 34
Fig. 3.6. Venn diagram of N. awatschensis exposed to 2 μg/L and 20 μg/L of cybutryne 36
Fig. 3.7. Networks of overlapping genes in 2 μg/L and 20 μg/L of cybutryne 37
Fig. 3.8. Volcano plots of N. awatschensis exposed to diuron and cybutryne 39
Fig. 3.9. GO enrichment analysis in N. awatschensis exposed to diuron 42
Fig. 3.10. GO enrichment analysis in N. awatschensis exposed to cybutryne 44
Fig. 3.11. KEGG pathway analysis in N. awatschensis exposed to diuron 46
Fig. 3.12. KEGG pathway analysis in N. awatschensis exposed to cybutryne 48
Fig. 3.13. Heatmap showing stress-related DEGs in N. awatschensis exposed to diuron and cybutryne 51
Fig. 3.14. Correlation of relative fold changes between qRT-RCR and RNA-seq results of N. awatschensis exposed to diuron and cybutryne 54
Fig. 3.15. Superoxide dismutase (SOD) and catalase (CAT) activity of N. awatschensis exposed to diuron. 56
Fig. 3.16. Glutathione peroxidase (GPx) and glutathione reductase (GR) activity of N. awatschensis exposed to diuron. 58
Fig. 3.17. Superoxide dismutase (SOD) and catalase (CAT) activity of N. awatschensis exposed to cybutryne. 60
Fig. 3.18. Glutathione peroxidase (GPx) and glutathione reductase (GR) activity of N. awatschensis exposed to cybutryne. 62
Fig. 3.19. Glutathione (GSH) and malondialdehyde (MDA) contents of N. awatschensis exposed to diuron. 64
Fig. 3.20. Glutathione (GSH) and malondialdehyde (MDA) contents of N. awatschensis exposed to cybutryne. 66
Fig. 3.21. AO and FG staining of N. awatschensis exposed to control, DMSO, and different concentrations of diuron and cybutryne for 24 h. Scale bar is 1000 μm, n=3. 68
Fig. 3.22. Red/Green ratio in N. awatschensis exposed to control, DMSO, and different concentrations of diuron and cybutryne for 24 h. The standard error of the mean is shown by... 69
*표시는 필수 입력사항입니다.
| 전화번호 |
|---|
| 기사명 | 저자명 | 페이지 | 원문 | 기사목차 |
|---|
| 번호 | 발행일자 | 권호명 | 제본정보 | 자료실 | 원문 | 신청 페이지 |
|---|
도서위치안내: / 서가번호:

우편복사 목록담기를 완료하였습니다.
*표시는 필수 입력사항입니다.
저장 되었습니다.
