
 대표어
대표어


권호기사보기
| 기사명 | 저자명 | 페이지 | 원문 | 기사목차 |
|---|
결과 내 검색
동의어 포함
Title page
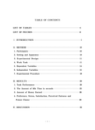
Contents
I. Introduction 8
II. Method 17
1. Participants 17
2. Setting and apparatus 17
3. Experimental design 18
4. Work task 18
5. Dependent variables 21
6. Independent variables 22
7. Experimental procedure 25
III. Results 27
1. Task performance 27
2. The amount of idle time in seconds 32
3. The amount of money earned 35
4. Preference, stress, satisfaction, fairness and future choice 37
IV. Discussion 39
V. Reference 43
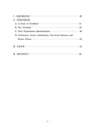
VI. Appendices 48
Appendi A - A Form of feedback 48
Appendi B - Pay schedule 49
Appendi C - Post-experiment questionnaire 56
Appendi D - Preference, stress, satisfaction, perceived fairness, and future choice 59
VII. 국문초록 62
VIII. Abstract 63
Figure1. The first step of the work task 19
Figure2. The second step of the work task 20
Figure3. The third step of the work task 21
Figure4. Pay formula in the individual incentive condition 22
Figure5. Pay formula in the equally distributed group incentive condition 23
Figure6. Pay formula in the differentially distributed group incentive condition 24
Figure7. The number of correctly completed work tasks per session under the three experimental conditions for participants 1 and 2 28
Figure8. The number of correctly completed work tasks persession under the three experimental conditions for participants 3 and 4 29
Figure9. The average number of correctly completed work tasks per session under the three experimental conditions 30
Figure10. The average amount of idle time in seconds per session under the three experimental conditions 33
*표시는 필수 입력사항입니다.
| 전화번호 |
|---|
| 기사명 | 저자명 | 페이지 | 원문 | 기사목차 |
|---|
| 번호 | 발행일자 | 권호명 | 제본정보 | 자료실 | 원문 | 신청 페이지 |
|---|
도서위치안내: / 서가번호:

우편복사 목록담기를 완료하였습니다.
*표시는 필수 입력사항입니다.
저장 되었습니다.
