
 대표어
대표어


권호기사보기
| 기사명 | 저자명 | 페이지 | 원문 | 기사목차 |
|---|
결과 내 검색
동의어 포함
표제지
목차
Ⅰ. 요약 8
Ⅱ. 서론 10
Ⅲ. 재료 및 방법 16
1. 밭토양의 유효규산 분석법 검토 16
1) 토양시료 및 분석방법 16
(1) 0.5 N HCl 용액 침출 16
(2) 1 N NaOAc (pH 4.0) 용액 침출 16
(3) Citric Acid 1% 용액 침출 16
(4) Water 침출 16
(5) Tris buffer (pH 7.0) 용액 침출 16
(6) Incubation method 17
2. 참외의 규산 이용과 토양 유효규산의 관계 17
1) 시료수집 17
2) 분석방법 17
3. 밭토양에서 규산질 비료의 유효화 및 유효인산과 pH에 미치는 영향 18
1) 토양시료 및 특성 18
2) 토양조제 19
3) 토양완충능 시험 20
4) 석회처리량에 따른 토양 유효규산 함량 변화 20
Ⅳ. 결과 및 고찰 21
1. 밭토양의 유효규산 분석법 검토 21
2. 참외의 규산 흡수와 토양 유효규산의 관계 29
3. 밭토양에서 규산질 비료 적정 시용량 30
1) 규산질 비료 처리 수준별 유효규산 함량 변화 30
2) 석회처리에 따른 토양 유효규산 함량 변화 35
3) 밭토양에서 규산질 비료 적정 시비량 추정 38
4. 밭토양에서 규산질 비료 시용으로 인한 토양 pH와 유효인산 함량 변화 42
1) 규산질 비료 시용과 토양 pH의 경시적 변화 42
2) 규산질 비료 시용과 토양 유효인산 함량의 경시적 변화 51
Ⅴ. 참고문헌 62
Abstract 69
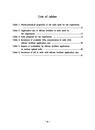
Fig. 1. Relationship between available SiO2 and plant SiO2 in various upland soils 23
Fig. 2. Relationship between available SiO2 and plant SiO2 in various upland soils 24
Fig. 3. Relationship between available SiO2 and plant SiO2 in various upland soils 25
Fig. 4. Relationship between available SiO2 and plant SiO2 in various upland soils 26
Fig. 5. Relationship between available SiO2 and plant SiO2 in various upland soils 27
Fig. 6. Relationship between available SiO2 and plant SiO2 in various upland soils 28
Fig. 7. Changes of available SiO2 concentration in soil A during the experiment 31
Fig. 8. Changes of available SiO2 concentration in soil B during the experiment 32
Fig. 9. Changes of available SiO2 concentration in soil C during the experiment 33
Fig. 10. Changes of available SiO2 concentration in soil D during the experiment 34
Fig. 11. Changes of pH with different treatments of lime in soil D 36
Fig. 12. Changes of available SiO2 concentration with different treatments of lime in soil D 37
Fig. 13. Changes of available SiO2 concentration with different silicate fertilizer treatments after 60 days of incubation period 41
Fig. 14. Changes of pH in soil A during the experiment 44
Fig. 15. Changes of pH in soil B during the experiment 45
Fig. 16. Changes of pH in soil C during the experiment 46
Fig. 17. Changes of pH in soil D during the experiment 47
Fig. 18. Changes of soil pH at different silicate fertilizer treatments after 60days of incubation period 49
Fig. 19. pH buffering of soils 50
Fig. 20. Changes of available P concentration in soil A during the experiment 53
Fig. 21. Changes of available P concentration in soil B during the experiment 54
Fig. 22. Changes of available P concentration in soil C during the experiment 55
Fig. 23. Changes of available P concentration in soil D during the experiment 56
Fig. 24. Changes of available P concentration in soil A at different silicate fertilizer treatments after 60 days of incubation period 58
Fig. 25. Changes of available P concentration in soil B at different silicate fertilizer treatments after 60 days of incubation period 59
Fig. 26. Changes of available P concentration in soil C at different silicate fertilizer treatments after 60 days of incubation period 60
Fig. 27. Changes of available P concentration in soil D at different silicate fertilizer treatments after 60 days of incubation period 61
*표시는 필수 입력사항입니다.
| 전화번호 |
|---|
| 기사명 | 저자명 | 페이지 | 원문 | 기사목차 |
|---|
| 번호 | 발행일자 | 권호명 | 제본정보 | 자료실 | 원문 | 신청 페이지 |
|---|
도서위치안내: / 서가번호:

우편복사 목록담기를 완료하였습니다.
*표시는 필수 입력사항입니다.
저장 되었습니다.
