
 대표어
대표어
권호기사보기
| 기사명 | 저자명 | 페이지 | 원문 | 기사목차 |
|---|
결과 내 검색
동의어 포함
LIST OF ABBREVIATIONS
국문초록
Abstract
Introduction
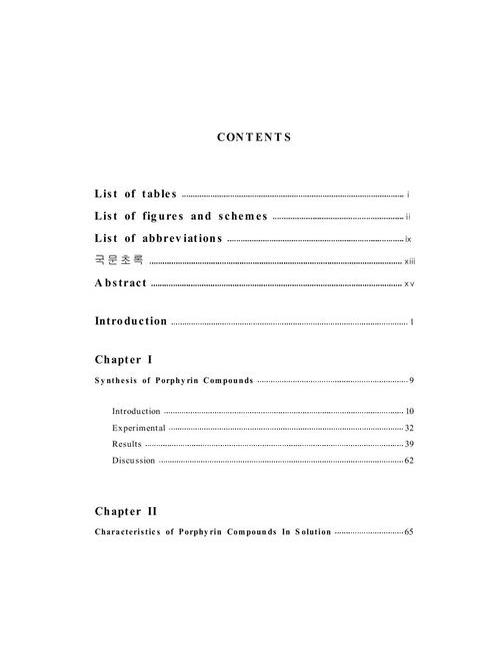
CONTENTS
Chapter I. Synthesis of Porphyrin Compounds 29
Introduction 30
Experimental 52
1. Reagents and Instruments 52
2. synthesis 52
Results 59
Discussion 82
Chapter II. Chaacte ristics of Porphyrin Compounds In Solution 85
Introduction 86
Experimental 90
Results 92
Discussion 115
Chapter III. Porphyrin Compounds as Acetylcholinesterase Inhibitors 119
Introduction 120
Experimental 139
i. Enzyme Inhibition studies of Porphyrin Compounds in vitro 139
ii. Enzyme Inhibition studies of Porphyrin Compounds in vivo 143
Results 145
i. Enzyme Inhibition studies of Porphyrin Compounds in vitro 145
ii. Enzyme Inhibition studies of Porphyrin Compounds in vivo 163
Discussion 167
Conclusion 171
References 175
ACKNOWLEDGEMENT 187
Figure 1. The cholinergic hypothesis 27
Figure 2. Common core structure of porphyrin analogues 31
Figure 3. The absorption spectra of porphin, tetraphenylporphyrin (TPP) and metalloporphyrins of T PP dissolved in toluene 36
Figure 4. The absorption spectra of TPP in toluene and diprotonated TPP (H4TPP) in chloroform + HCl 37
Figure 5. Decay scheme for singlet and triplet relaxation. The radiation processes are shown as straight lines ; radiationless processes are shown by wavy lines . 39
Figure 6. The fluorescence emis sion spectrum of porphin, T PP, MgTPP and ZnT PP in toluene 40
Figure 7. The fluorescence emis sion spectrum of T PP in toluene and diprotonat ed-tetraphenylporphyrin (H4TPP) in chloroform + HCl 41
Figure 8. The structure of tetraphenylporphyrins 49
Figure 9. The absorption spectra of 2-F4T PP in acetone 62
Figure 10. The absorption spectra of 3-F4T PP in acetone 62
Figure 11. The absorption spectra of 4-F4T PP in acetone 63
Figure 12. The absorption spectra of 2,5-F8TPP in acetone 63
Figure 13. The absorption spectra of 2,6-F8TPP in acetone 64
Figure 14. The absorption spectra of 2-(OH)4TPP in acetone 64
Figure 15. The absorption spectra of 3-(OH)4TPP in acetone 65
Figure 16. The absorption spectra of 4-(OH)4TPP in acetone 65
Figure 17. The absorption spectra of 2,5-(OH)8TPP in acetone 66
Figure 18. The fluorescence emis sion spectra of 2-F4T PP in acetone 67
Figure 19. The fluorescence emis sion spectra of 3-F4T PP in acetone 67
Figure 20. The fluorescence emis sion spectra of 4-F4T PP in acetone 68
Figure 21. The fluorescence emis sion spectra of 2,5-F8T PP in acetone 68
Figure 22. The fluorescence emis sion spectra of 2,6-F8T PP in acetone 69
Figure 23. The fluorescence emis sion spectra of 2-(OH)4T PP in acetone 69
Figure 24. The fluorescence emis sion spectra of 3-(OH)4T PP in acetone 70
Figure 25. The fluorescence emis sion spectra of 4-(OH)4T PP in acetone 70
Figure 26. The fluorescence emis sion spectra of 2,5-(OH) in acetone (Excitation mono slits = 1.50 mm, Emission mono slits = 1.50 mm) 71
Figure 27. The �H NMR spectra of TPP (in CD2Cl2 ) 73
Figure 28. The �H NMR spectra of 2-F4TPP (in acetone-d6 ) 74
Figure 29. The �H NMR spectra of 3-F4TPP (in acetone-d6 ) 75
Figure 30. The �H NMR spectra of 4-F4TPP (in acetone-d6 ) 76
Figure 31. The �H NMR spectra of 2,5-F8TPP (in acetone-d6 ) 77
Figure 32. The �H NMR spectra of 2,6-F8TPP (in CDCl3 ) 78
Figure 33. The �H NMR spectra of 2-(OH)4TPP (in acetone-d6 ) 79
Figure 34. The �H NMR spectra of 4-(OH)4TPP (in acetone-d6 ) 80
Figure 35. The �H NMR spectra of 2,5-(OH)8TPP (in acetone-d6 ) 81
Figure 36. HCl titmetric absorption spectra of 2.3�10-6 M TPPH2 in DMSO) 94
Figure 37. Degree of formation of T PPH 2 + in DMSO as a function of [HCl] at 300 K 95
Figure 38. The degree of diprotonation as a function of HCl concentration for the various T PP derivatives in DMSO concentration for the various T PP derivatives in DMSO 98
Figure 39. Temperature dependent change of the absorption profile of T PPH2 in acidic DMSO (1.2�10-2 M HCl) 101
Figure 40. Van' t Hoff plot s of TPPH2 (square), 2-F4T PPH2 (circle), and 2,6-F8T PPH2 (triangle) in acidic ethylene glycol 102
Figure 41. Absorption and fluorescence spectra of TPPH2 , TPPH 2 + in DMSO, showing the dramatic increase of Stokes shift upon protonation 105
Figure 42. Fluorescence decay profiles of the lamp (A), TPPH2 in DMSO excited at 418 nm(B) 106
Figure 43. Energy diagram representing the protonation of TPPH₂ 107
Figure 44. Time- dependent absorption measurement of the aggregation of 110
Figure 45. Uncorrected RLS spectra of the aggregat ed (solid) and 111
Figure 46. The proposed diagram for molecular aggregation of 2,6- F8T PP 114
Figure 47 . Proposed mechanism of the hydrolytic reaction catalysed by 126
Figure 48 . The effect of substrate concentration on the initial velocity of a 129
Figure 49. The Lineweaver - Burk plot 130
Figure 50. The impact of competitive inhibitors on Lineweaver - Burk plots . 135
Figure 51. The impact of uncompetitive inhibitors on Lineweaver - Burk 136
Figure 52 . The impact of noncompetit ive inhibitors on Lineweaver - Burk 137
Figure 53A. The Michaelis -Menten plots at different substrate (AT Ch) concentrations and inhibitor (2- F4TPP) concentrations . 149
Figure 53B. The Lineweaver -Burk plot of AChE activity at different 149
Figure 54A. The Michaelis -Menten plot s at different substrat e (AT Ch ) 150
Figure 54B . The Lineweaver - Burk plot of AChE activity at different 150
Figure 55A. The Michaelis -Menten plot s at differ ent substrate (AT Ch ) 151
Figure 55B. The Lineweaver - Burk plot of AChE activity at different 151
Figure 56A . The Michaelis -Menten plots at differ ent substrat e (AT Ch ) 152
Figure 56B. The Lineweaver - Burk plot of AChE activity at different 152
Figure 57A. The Michaelis -Menten plots at differ ent substrate (AT Ch ) 153
Figure 57B. The Lineweaver - Burk plot of AChE activity at different 153
Figure 58A. The Michaelis -Menten plots at differ ent substrate (AT Ch ) 154
Figure 58B. The Lineweaver - Burk plot of AChE activity at different 154
Figure 59A. The Michaelis -Menten plots at differ ent substrate (AT Ch ) 155
Figure 59B. The Lineweaver - Burk plot of AChE activity at different 155
Figure 60A. The Michaelis -Menten plots at differ ent subsTrate (AT Ch ) 156
Figure 60B. The Lineweaver - Burk plot of AChE activity at different substrate (AT Ch) 156
Figure 61. The Km /Vmax versus inhibitor (2- F4T PP ) concentration plot . 157
Figure 62. The Km /Vmax versus inhibitor (3- F4TPP ) concentration plot . 157
Figure 63. The Km /Vmax versus inhibitor (2,5- F8T PP ) concentration plot . 158
Figure 64. The Km /Vmax versus inhibitor (2,6- F8T PP ) concentration plot . 158
Figure 65. The Km /Vmax versus inhibitor (2- (OH)4TPP ) concentration plot 159
Figure 66. The Km /Vm a x versus inhibitor (3- (OH)4TPP ) concentration plot 159
Figure 67. The Km /Vmax versus inhibitor (4- (OH)4TPP ) concentration plot . 160
Figure 68. The Km /Vmax versus inhibitor (2,5- (OH)8TPP ) concentration plot . 160
Figure 69. The ratio of brain/ body weight of the groups . 165
Figure 70. The activity of AChE in the rat brain homogenate. 165
Scheme 1-3 44
Scheme 1-6 47
Scheme 1-9 48
Scheme 2 Two- step one- flask synthesis of tetraphenylporphyrins (Feironget al., 1997) 51
Scheme 3-1 Model for competitive inhibitor 134
Scheme 3-2 Model for competitive inhibitor 134
Scheme 3-3 Model for noncompetitive inhibitor 134
Scheme 4 The Ellman ' s coupled enzyme as say 141
*표시는 필수 입력사항입니다.
| 전화번호 |
|---|
| 기사명 | 저자명 | 페이지 | 원문 | 기사목차 |
|---|
| 번호 | 발행일자 | 권호명 | 제본정보 | 자료실 | 원문 | 신청 페이지 |
|---|
도서위치안내: / 서가번호:

우편복사 목록담기를 완료하였습니다.
*표시는 필수 입력사항입니다.
저장 되었습니다.
